I wrote about how to collect data from DS18B20 temperature sensor with Raspberry Pi a few months ago, and this is an article on how to do some basic data analysis using Python with the collected DS18B20 temperature sensor data.
NumPy, Pandas and Matplotlib
Pandas is a python library providing high-performance, easy-to-use high level data structures and data analysis tools for data manipulation. Pandas is built on top of NumPy, which supports large, multi-dimensional arrays and matrices, along with a large collection of mathematical functions to operate on these arrays. For plotting data, I'm using Matplotlib to generate various 2D plots. The installation of those packages can be found in its respective websites so I won't discuss here.
Convert raw data
As per my previous article, the data that collected from DS18B20 temperature sensor are stored in /var/log/ds18b20.log log file on my Raspberry Pi, run tail ds18b20.log will provide a snapshot of the data:
2017-07-24_10:10:01 31187
2017-07-24_10:20:02 31062
2017-07-24_10:30:02 85000
2017-07-24_10:40:02 31250
2017-07-24_10:50:02 31312
2017-07-24_11:00:02 31312
2017-07-24_11:10:02 31312
2017-07-24_11:20:02 31125
2017-07-24_11:30:02 31312
2017-07-24_11:40:02 31437
The ds18b20.log is in text format with each line consists of two piece of data separated by a space, a timestamp, and a temperature reading from the DS18B20 (e.g. 29000 means 29 degree Celsius). In order to use the log for data analysis, we need to:
- Read the each line of the data log;
- The timestamp string need to be converted into a Python date time object;
- The temperature need to convert to floating number, and further divided by 1000 to get the actual celsius degree.
- Create a Pandas Data Frame object with those data for further analysis
Clean up data
In many IoT or data sensor applications, it is often that the collected data would consists of errors, for example, I noticed that due to transmission error (I have solved this problem but those early data log consists the historical data log with errors), the data occasionally consists of an error reading with a temperature of 85000, there is a need to clean up the data before further analysis.
I found out later that error reading
85000was caused when powering the DS18B20 with 3.3v, it became less reliable and subject to noisy. I was using a pull-up resistor of 10k. The solution is to either user a lower pull-up resistor value (for example, to 2.2k if you have a very long cable, or 4.7k as recommended by Maxim) and/or add a cap to the power line near the sensor and pull-up resistor
import numpy as np
import pandas as pd
import datetime as dt
import matplotlib.pyplot as plt

def get_data(file_name):
    # Get data from ds18b20.log file
    df = pd.read_csv(file_name, names = ['Date', 'Temp'], header = None, sep = ' ')
    df['Date'] = [dt.datetime.strptime(datestr, '%Y-%m-%d_%H:%M:%S') for datestr in df['Date']]
    df['Temp'] = df['Temp']/1000.
    df.index = df['Date']
    return df

def clean_up_data(df):
    # Clean up data with error reading of 85.0
    temps = np.array(df['Temp'])
    if temps[0] == 85.:
        temps[0] = temps[1]
    if temps[-1] == 85.:
        temps[-1] = temps[-2]
    for i in range(len(temps)):
        if temps[i] == 85.:
            temps[i] = np.mean([temps[i-1], temps[i+1]])
    df['Temp'] = temps
Save this code as ds18b20_functions.py so that we could reuse it in our main program later.
The get_data function read the ds18b20.log and covert data into the appropriated format as mentioned above. The function return a pandas data frame. We also explicitly set the df['Date'] as the index of the data frame. This will make it easier to retrieve a part of the data, such as daily data or hourly data, later on.
The clean_up_data function clean up the error data. I used the data from adjacent time slots(the previous temperature entry and the next temperature entry) to calculate the average temperature for replacing the error data 85000, the function also take care the corner cases where the error data happened as the first or last data entry. We now the data frame ready for further analysis.
Basic Data Analysis
We can easily plot the entire data log in a 2D graph using Pandas plot function which is a higher level wrapper of marplotlib.pyplot function.
from ds18b20_functions import *

df = get_data('ds18b20.log')
clean_up_data(df)

# plot the entire data log
plot_obj = df.plot(x = 'Date', y = 'Temp', figsize = (10,7), title = 'DS18B20 Temperature Reading', legend = None, grid = True, rot = 30)
plot_obj.set_ylabel('Temperature (Degree C)')
plt.show()
This will plot the entire data log in a graph:
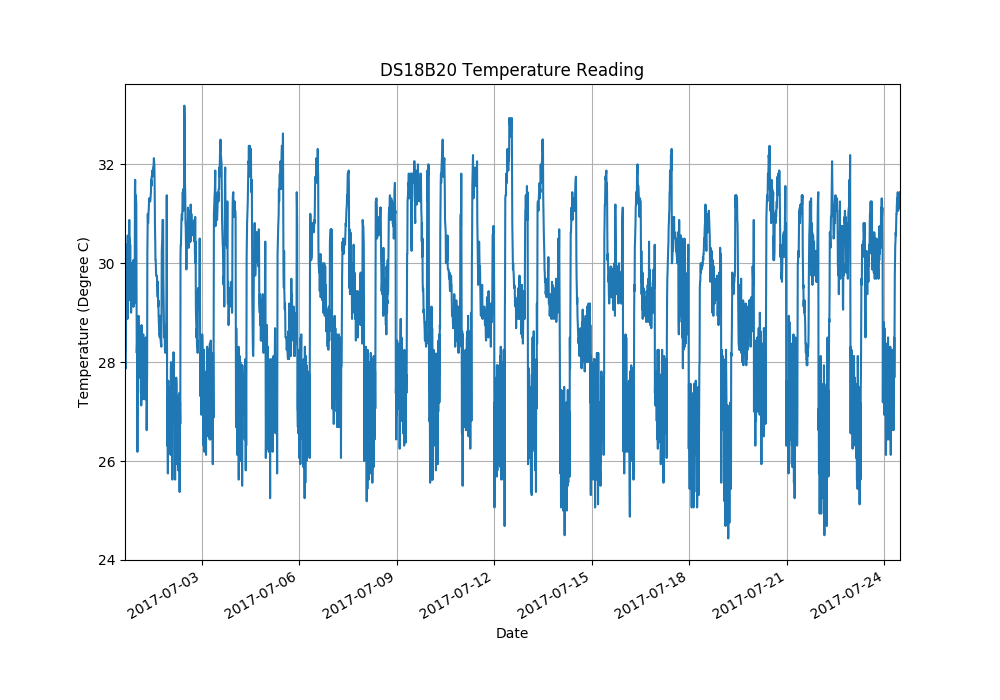
Well, the chart basically showing the temperature fluctuate between somewhat 25 degree Celcius to 32 degree Celcius, it is clearly summer time for sure (I actually living in tropical area), there are not much to tell other than that.
Data Extraction
It make more sense to get the daily temperature data for a particular date. We will modify our code a little bit to get the daily data, the rest of the code are basically the same as previous example:
from ds18b20_functions import *

df = get_data('ds18b20.log')
clean_up_data(df)

# Get the data for a particular date, e.g. '2017-07-22'
df['Time'] = [timestr.time() for timestr in df['Date']]
july22 = df.loc['2017-07-22 00:00:00':'2017-07-22 23:59:59']

plot_obj = july22.plot(x = 'Time', y = 'Temp', figsize = (10,7), title = 'DS18B20 Temperature Reading on July 22', legend = None, grid = True, rot = 30)
plot_obj.set_ylabel('Temperature (Degree C)')
plt.show()
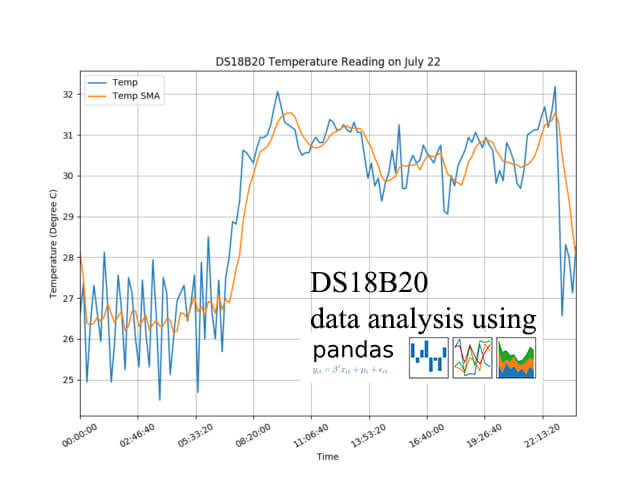
This gives much better insight on a daily fluctuation of temperatures. The creation of a new data from column df['Time'] which contains only the time without date information is not really necessary, but it provide a better visual information for x axis on the plot. df.loc[] select partial of the data frame based on the date index, this allows us to get a particular date's data frame.
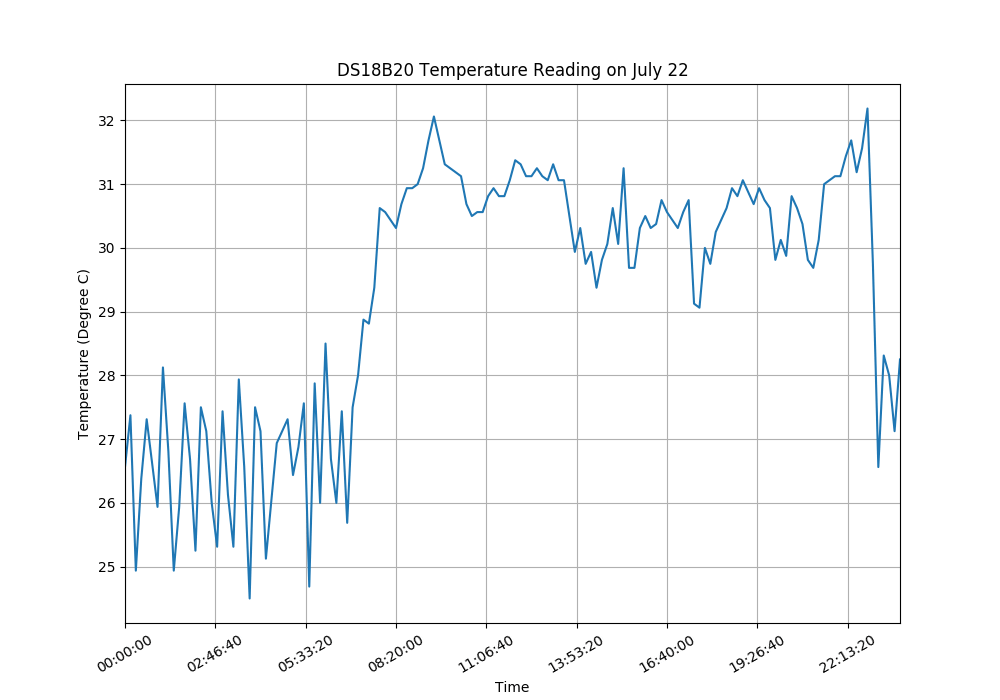
With this we should be able to view the data on any given date, or with minor modification of the df.loc[] range to get weekly and monthly data.
Simple Moving Average
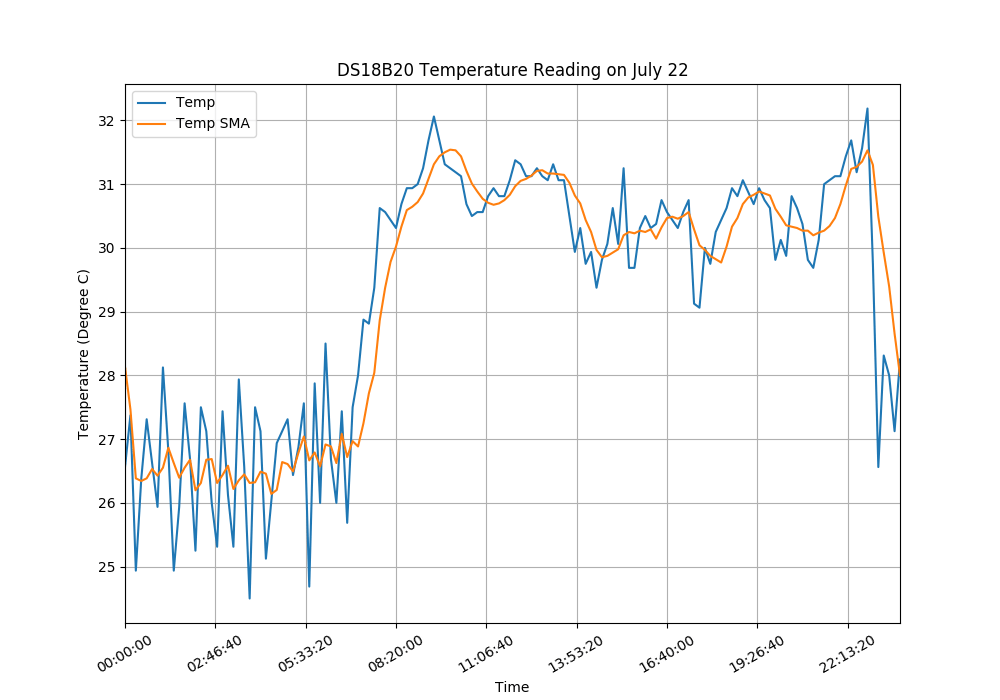
Simple Moving Average or Moving Average in short means takes a moving window of time, and calculates the average or the mean of the data during that time period as the current value. In our case, we have temperature data for every 10 minute. So we could get an hourly moving average of average out the temperature data during 6 time periods. Doing this is Pandas is incredibly fast and easy.
from ds18b20_functions import *

df = get_data('ds18b20.log')
clean_up_data(df)

# Get the data for a particular date, e.g. '2017-07-22'
df['Time'] = [timestr.time() for timestr in df['Date']]
df['Temp SMA'] = df['Temp'].rolling(window = 6).mean()
july22 = df.loc['2017-07-22 00:00:00':'2017-07-22 23:59:59']

plot_obj = july22.plot(x = 'Time', y = ['Temp','Temp SMA'], figsize = (10,7), title = 'DS18B20 Temperature Reading on July 22', grid = True, rot = 30)
plot_obj.set_ylabel('Temperature (Degree C)')
plt.show()
We calculate the result of moving average and add it into a newly create column into the data frame, and we are going to plot both the raw temperature data and the moving average on the sample chart.
Data Resample
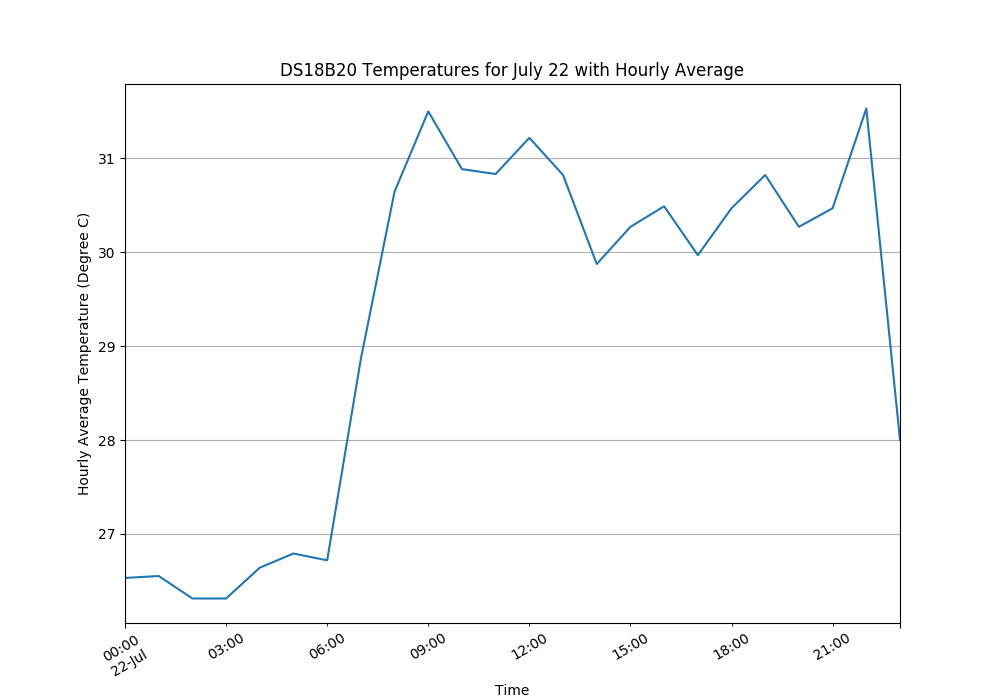
Sometime too much details does not necessarily provide the clarity. For example, as my ds18b20.log records the temperature data every 10 mins, and we may want to just present an hourly average data. To do that we need to resample the temperature data and calculate every hour's average temperature. Luckily this can be done easily using pandas Data Frame package.
from ds18b20_functions import *

df = get_data('ds18b20.log')
clean_up_data(df)

theDate = df.loc['2017-07-22':'2017-07-22']
# Resample the temperature data to hourly average
temp_resample = theDate.Temp.resample('H').mean()
dt_range = pd.date_range('2017-07-22', periods = 24, freq = 'H')
# Create a new data frame withe the resampled data
hourly_average = pd.DataFrame({'Time': dt_range, 'Temp': np.array(temp_resample)}, index = dt_range)

plot_obj = hourly_average.plot(x = 'Time', y = 'Temp', figsize = (10,7), title = 'DS18B20 Temperatures for July 22 with Hourly Average', legend = None, grid = True, rot = 30)
plot_obj.set_ylabel('Hourly Average Temperature (Degree C)')
plt.show()
Summary
Data manipulation and presentation are the basic of any data analysis. In this article, I shows the concept of extracting partial data from a text data log and other data manipulation techniques such as calculating moving average, resample a data set. With these examples, it is easily to modify the code to meet other requirements.
That's all for now, have fun with your data!
The code examples available at my github repository.
Hi,
I just found your EXCELLENT write-up on the DS18B20. I walked through your code and I am trying to figure out how I can loop the code to include my (23) DS18B20 sensors that I am in the process of installing. I then want to send the data (probably every 10 minutes) to my website (www.how-to-doit.com) where I will make a page with the data updating each 10 minutes. I am very new at python, so this will be a real challenge. Do you happen to have a script that includes getting data for more than (1) DS18B20 sensor. I figure that the first fields of each record would have to include the SN of each sensor [28:FF:FF:CC:4F:81:14:02:93] 2019-01-01 00:00:00 31312 followed by the date, time and the raw temperature data. Not sure if each sensor should have its own log file or combined in one file, I am looking at a single file for each.
Thanks, Don
Personally, I had never used more than 1 one-wire sensor (DS18B20) for my projects, as for multiple sensors I personally prefer to use those sensors with I2C protocol, but connecting multiple DS18B20 is certainly possible. As the number of sensors and distances increase, you may need to look into having a dedicated 1-wire master chips with a proper driving circuit (e.g. DS2482).
On software side, as I used shell script instead of python for reading the sensor, you could either continue to use shell script by adding a foo..loop or convert it into a python script. Since you want to display on a web page, in addition to save the sensor data to a file, you might want to look into publishing the data via mqtt protocol, and for the webpage to subscript to the mqtt topics and render the data on the webpage. With 23 sensor data to be displayed on a webpage, you might also want to look into node-RED, which is a JavaScript-based drag-and-drop programming tool and excellent for those who are not familiar with programming or python. I recently wrote a blog on how to use node-RED to control GPIO (https://www.e-tinkers.com/2019/02/control-raspberry-pi-gpio-using-node-red/), it may not be directly relevant to your project, but give you a flavour on how the dashboard looks like and how to use node-RED in your project.
Let me know how your project go or if you have any question.
Don,
Here is a script for reading multiple DS18B20 (not test as I don’t have an environment for testing multiple DS18B20 now):
#!/bin/bash # list of ID of the devices you'd want to read device_list = "28-000008284fb7 28-00000xxxxxxx 28-00000yyyyyyy 28-00000zzzzzzz" for device in $device_list ; do temp=$(cat /sys/bus/w1/devices/$device/w1_slave) timestamp=$(date +%Y-%m-%d_%H:%M:%S) echo $device' '$timestamp' '${temp: -5} >> /var/log/ds18b20.log doneAll sensor names don’t begin with “28-“. I have one that begins with “10-“. Easy to adjust but never hardcode things.
Those started with “10-” are likely fake DS18B20, that’s you mostly get from aliexpress or other Chinese e-commerce platforms, they are at least not from Maxim. See Your DS18B20 temperature sensor is likely a fake, counterfeit, clone… for more details.
However, “never hardcode things” is a good coding habit to remember.