Other than tinkering electronics hardware and computer programming, I spend a lot of time on cycling, this article combines my cycling hobby with my programming skill and talk about how to plot cycling route using Google Map API and Python Flask web framework.
Over the past several years, I tried many sport activity tracking mobile apps, one problem with frequent switching of different apps is data retention as I'd like to keep a record of all my riding routes, although many apps allow me to download my activity routes to my computer hard disk, but I would need an application to visualise the route, for example, showing it on Google Map.
Google Maps JavaScript API
First, let's looks at Google Maps Javascript API. In order to use Google Maps JavaScript API, you will need to register to get an API key.
Google Maps JavaScript API documentation provides extensive coverage on how to use the API which I won't need to repeat here. In a nutshell, a map object needed to be created along with a list of parameters that need to be passed into the map object. Parameters include where in the html document the map should be shown, as well as the zooming level and the center location of the map in terms of latitude and longitude. So I create a template.html after studying the Google Maps API. I also create this html template based on Jinja template engine format as I intend to create the web page using python Flask web framework later.
template.html
 <!DOCTYPE html>
 <html>
   <head>
     <meta charset="utf-8">
     <title>{{ context.title }}</title>
     <style>
       #map-canvas {
         height: 550px;
         weight: 100%
       }
     </style>
 </head>
 <body>
   <div id="map-canvas"></div>
   <div id="elevation_chart">{{ map.altitude_svg|safe }}</div>
   <script>
   function showMap() {
     var path = [{{ map.google_coordinates }}];
     var center = new google.maps.LatLng({{ map.center[0] }}, {{ map.center[1]  }});
     var zoom = {{ map.zoom }};

     map = new google.maps.Map(document.getElementById("map-canvas"), {
         zoom: zoom,
         center: center,
         mapTypeId: 'terrain'
     });

     var activity_route = new google.maps.Polyline({
         path: path,
         geodesic: true,
         strokeColor: '#550FFF',
         strokeOpacity: 1.0,
         strokeWeight: 3,
         map: map
     });

     var start = new google.maps.Marker({
        position: path[0],
        map: map,
        label: 'S',
        fillColor:'green'
     });

     var end = new google.maps.Marker({
        position: path[path.length-1],
        map: map,
        label: 'E'
      });
   }
   </script>
   <script async
       src="https://maps.googleapis.com/maps/api/js?key={{ context.key }}&v=3.31&use_slippy=true&callback=showMap">
   </script>
 </body>
 </html>
Once a map that is properly centered and zoomed we can start plotting the route by creating a Google Map Polylines object class and pass in the activity coordinates. The activity_coordinates is a JavaScript array contains the coordinates of the route to be plotted.
By setting up google.maps.Map instance and google.maps.Polyline instance together with the data to be passed in will be sufficient to plot the activity route on the map. In addition to that, we also setting up two google.maps.Marker instances, one with the starting position coordinate and another with the ending position coordinates.
The script tag near the end of the html template load the Google Maps JavaScript file that provides all the classes and functionalities for using the Google Maps JavaScript API. This is where the API key is passed in as part of url query string. When the web page is loaded, it will call the function specified using the callback parameter, which is our showMap() function.
In summary, by looking at the template that we setup, we will need 5 data (those marked within {{ xxx }} in our template.html) to be passed into the template for rendering the google map with the activity route. We will see how we could get those data.
TCX data exchange format
To download the sport activity data, you will need to login to the website of your sport activity app. Most of the activity tracking app allow user to download route data in TCX format (many provide more than TCX format). TCX stands for Training Center XML, which is a data exchange format introduced in 2007 as part of Garmin's Training Center product.


TCX data contains a series of "trackpoints" with information such as latitude, longitude, altitude, time lapsed and distance. Here are the TCX XML structure of two apps that I mostly use:
TCX data from Endomondo
<?xml version="1.0" encoding="UTF-8"?>
<TrainingCenterDatabase xmlns="http://www.garmin.com/xmlschemas/TrainingCenterDatabase/v2" xmlns:xsi="http://www.w3.org/2001/XMLSchema-instance" xsi:schemaLocation="http://www.garmin.com/xmlschemas/TrainingCenterDatabase/v2 http://www.garmin.com/xmlschemas/TrainingCenterDatabasev2.xsd">
  <Activities>
    <Activity Sport="Biking">
      <Id>2018-01-17T02:39:26Z</Id>
      <Lap StartTime="2018-01-17T02:39:24Z">
        <TotalTimeSeconds>14354.48</TotalTimeSeconds>
        <DistanceMeters>80500.9994506836</DistanceMeters>
        <Calories>2071</Calories>
        <Intensity>Active</Intensity>
        <TriggerMethod>Manual</TriggerMethod>
        <Track>
          <Trackpoint>
            <Time>2018-01-17T02:39:24Z</Time>
            <Position>
              <LatitudeDegrees>1.3556546</LatitudeDegrees>
              <LongitudeDegrees>103.8453484</LongitudeDegrees>
            </Position>
            <DistanceMeters>0.0</DistanceMeters>
          </Trackpoint>
          <Trackpoint>
            <Time>2018-01-17T02:40:01Z</Time>
            <Position>
              <LatitudeDegrees>1.3556546</LatitudeDegrees>
              <LongitudeDegrees>103.8453484</LongitudeDegrees>
            </Position>
            <AltitudeMeters>20.7</AltitudeMeters>
            <DistanceMeters>0.0</DistanceMeters>
          </Trackpoint>
          ...
        </Track>
      </Lap>
    </Activity>
  </Activities>
TCX data from Ride with GPS
<?xml version="1.0" encoding="UTF-8"?>
<TrainingCenterDatabase xmlns="http://www.garmin.com/xmlschemas/TrainingCenterDatabase/v2" xmlns:xsi="http://www.w3.org/2001/XMLSchema-instance" xsi:schemaLocation="http://www.garmin.com/xmlschemas/TrainingCenterDatabase/v2 http://www.garmin.com/xmlschemas/TrainingCenterDatabasev2.xsd">
  <Folders>
    <Courses>
      <CourseFolder Name="Courses">
        <CourseNameRef>
          <Id>Amakusa_L2_1_Iz</Id>
        </CourseNameRef>
      </CourseFolder>
    </Courses>
  </Folders>
  <Courses>
    <Course>
      <Name>Amakusa_L2_1_Iz</Name>
      <Lap>
        <TotalTimeSeconds>1622</TotalTimeSeconds>
        <DistanceMeters>44029.4</DistanceMeters>
        <BeginPosition>
          <LatitudeDegrees>32.08833</LatitudeDegrees>
          <LongitudeDegrees>130.35396</LongitudeDegrees>
        </BeginPosition>
        <EndPosition>
          <LatitudeDegrees>32.18828</LatitudeDegrees>
          <LongitudeDegrees>130.10366</LongitudeDegrees>
        </EndPosition>
        <Intensity>Active</Intensity>
      </Lap>
      <Track>
        <Trackpoint>
          <Time>2018-03-15T07:46:29Z</Time>
          <Position>
            <LatitudeDegrees>32.08833</LatitudeDegrees>
            <LongitudeDegrees>130.35396</LongitudeDegrees>
          </Position>
          <AltitudeMeters>15.7</AltitudeMeters>
          <DistanceMeters>0</DistanceMeters>
        </Trackpoint>
        <Trackpoint>
          <Time>2018-03-15T07:46:39Z</Time>
          <Position>
            <LatitudeDegrees>32.08754</LatitudeDegrees>
            <LongitudeDegrees>130.35473</LongitudeDegrees>
          </Position>
          <AltitudeMeters>16.3</AltitudeMeters>
          <DistanceMeters>114.051</DistanceMeters>
        </Trackpoint>
        <Trackpoint>
          <Time>2018-03-15T07:46:59Z</Time>
          <Position>
            <LatitudeDegrees>32.08716</LatitudeDegrees>
            <LongitudeDegrees>130.35424</LongitudeDegrees>
          </Position>
          <AltitudeMeters>14.5</AltitudeMeters>
          <DistanceMeters>176.701</DistanceMeters>
        </Trackpoint>
        ...
      </Track>
    </Course>
  </Courses>
The first dataset is from Endomondo. The second dataset is from Ride with GPS. The schemas are similar but there are subtle differences. For each <Trackpoint> and its child nodes are identical for both apps. However, there are difference in naming convention and data hierarchy for data above the <Trackpoint> which affect the way on how to parse the data. For Endomondo data, <AltitudeMeters> information is always missing from the first Trackpoint.
Parsing TCX data
With this understanding of TCX data structure, I can write my python Route class (in Flask terminology, it is a Route model), which take in a TCX route file and create a Route.trackpoints property that consists of of all the trackpoint data, such as latitudes, longitudes, altitudes, time lapsed and accumulated distance. To plot the route on Google Map, Google Map Javascript API only need latitude and longitude to generate the map.
Route class
import sys
import datetime as dt
from os.path import splitext
from xml.dom import minidom

class Route:
    """
    Parse a tcx route file and generate all trackpoints in a list of tuples that consists of
    latitude, longitude, altitude, timelapsed, and distance(accumulated)
    """
    def __init__(self, route_file):
        """
        Read the tcx route file, and parse the file to get all the trackpoints.
        Useage: route = Route(route_file)
                route.trackpoints to get all the trackpoints
        :param route_file: file in tcx format
        """
        self.title = splitext(route_file)[0]
        self.trackpoints = []

        try:
            dom = minidom.parse(route_file)
        except FileNotFoundError as e:
            print("Error({0}): {1}".format(e.errno, e.strerror))
            sys.exit()
        tracknodes = dom.getElementsByTagName("Trackpoint")
        self._parse_trackpoints(tracknodes)

    def _parse_trackpoints(self, trkpts):
        for trackpoint in trkpts:
            tm_node = trackpoint.getElementsByTagName("Time")[0]
            tm = self._to_local(tm_node.firstChild.data)

            lat_node = trackpoint.getElementsByTagName("LatitudeDegrees")[0]
            lat = float(lat_node.firstChild.data)

            lng_node = trackpoint.getElementsByTagName("LongitudeDegrees")[0]
            lng = float(lng_node.firstChild.data)

            # In the case of Endomondo, AltitudeMeters is not always available
            try:
                alt_node = trackpoint.getElementsByTagName("AltitudeMeters")[0]
                alt = float(alt_node.firstChild.data)
            except IndexError:
                alt = 0.0

            dist_node = trackpoint.getElementsByTagName("DistanceMeters")[0]
            dist = float(dist_node.firstChild.data)

            self.trackpoints.append((lat, lng, alt, tm, dist))

    @staticmethod
    def _to_local(utc_datetime):
        """
        Helper function to cover utc time to local time
        """
        utc = dt.datetime.strptime(utc_datetime, '%Y-%m-%dT%H:%M:%SZ')
        offset = dt.datetime.utcnow() - dt.datetime.now()
        return (utc - offset).strftime("%Y-%m-%d %H:%M:%S")
There are several python libraries can be used for parsing the xml. I tried BeautifulSoup and xml.dom.minidom, personally I'm very much like to use BeautifulSoup as it is very intuitive and allows me to write compact code to get the job done, but it is 4-5 times slower than xml.dom.minidom. The minidom did a great job in performance, but it is quite verbalsive, and its naming convention definitely not "pythonic", I feel like writing code in JavaScript, but due to its performance, I eventually decided to use minidom for parsing the xml.
Converting Python list to JavaScript object
The trackpoints data we get from Route class is an python list contains a series of tuples of latitude and longitude, this can't be applied directly to Google JavaScript code as it is expecting a Javascript array consists of a series of JavaScript object. I created a Map class that upon the instantiation, with passing in the Route.trackpoints data, it will create a Map.google_coordinates property that is a string that looks like this:
'{lat: 1.3601364, lng: 103.8466999}, ... {lat: 1.3602639, lng: 103.8466028}'
This allows us to pass it in as a string directly to our template.html.
Map class
import math
import matplotlib.pyplot as plt
from io import BytesIO

class Map:
    def __init__(self, points):
        """
        Instantiate an Map object with route corodinates added to the Map object
        :param points: a list of tuples contains latitude and longitude of a route
        """
        self._points = points
        self.google_coordinates = ",\n".join(["{{lat: {lat}, lng: {lng}}}".format(lat=x, lng=y) for x, y, *rest in self._points])

    @property
    def zoom(self):
        """
        Algorithm to derive zoom from a route. For details please see
        - https://developers.google.com/maps/documentation/javascript/maptypes#WorldCoordinates
        - http://stackoverflow.com/questions/6048975/google-maps-v3-how-to-calculate-the-zoom-level-for-a-given-bounds
        :return: zoom value 0 - 21 based on the how widely spread of the route coordinates
        """
        map_size = {"height": 900, "width": 1900}
        max_zoom = 21   # maximum zoom level based on Google Map API
        world_dimension = {'height': 256, 'width': 256}     # min map size for entire world

        latitudes = [lat for lat, lon, *rest in self._points]
        longitudes = [lon for lat, lon, *rest in self._points]

        # calculate longitude span between east and west
        delta = max(longitudes) - min(longitudes)
        if delta < 0:
            lon_span = (delta + 360) / 360
        else:
            lon_span = delta / 360

        # calculate latitude spread between south and north
        lat_span = (self._lat_rad(max(latitudes)) - self._lat_rad(min(latitudes))) / math.pi

        # get zoom for both latitude and longitude
        zoom_lat = math.floor(math.log(map_size['height'] / world_dimension['height'] / lat_span) / math.log(2))
        zoom_lon = math.floor(math.log(map_size['width'] / world_dimension['width'] / lon_span) / math.log(2))

        return min(zoom_lat, zoom_lon, max_zoom)-1

    @property
    def center(self):
        """
        Calculate the center of the current map object
        :return: (center_lat, center_lng) latitude, longitude represents the center of the map object
        """
        center_lat = (max((x[0] for x in self._points)) + min((x[0] for x in self._points))) / 2
        center_lng = (max((x[1] for x in self._points)) + min((x[1] for x in self._points))) / 2
        return center_lat, center_lng

    @property
    def altitude_svg(self):
        """
        Create an svg data object using matplotlib for altitude chart that can be injected into html template
        :return: altitude_svg; svg data for altitude chart
        """
        altitudes = [alt for lat, lng, alt, *rest in self._points]
        distances = [dist for *rest, dist in self._points]
        plt.figure(figsize=(12, 1.5))
        plt.ylabel('Altitude(m)')
        plt.tight_layout()
        plt.plot(distances, altitudes)
        svg_file = BytesIO()
        plt.savefig(svg_file, format='svg')     # save the file to io.BytesIO
        svg_file.seek(0)
        altitude_svg = svg_file.getvalue().decode() # retreive the saved data
        altitude_svg = '<svg' + altitude_svg.split('<svg')[1]   # strip the xml header
        return altitude_svg

    @staticmethod
    def _lat_rad(lat):
        """
        Helper function for calculating latitude spread across the map
        """
        sinus = math.sin(math.radians(lat + math.pi / 180))
        rad_2 = math.log((1 + sinus) / (1 - sinus)) / 2
        return max(min(rad_2, math.pi), -math.pi) / 2
Determine zoom level and the center of the map
Google Map provide zooming level between 1 to 21, 21 be the most zooom-in to street level, and 1 be the most zoom-out level for the entire world. The best user experience for our cycling route is to present the entire route on the map canvas for user to interact with. This basically need to calculate how wide that our cycling route's latitudes and longitudes
spread across the map. I get my help from a stackoverflow post, which is in JavaScript code and I port it into Python to create a Map.zoom property which is the zooming level that we will pass into our html template for rendering the map.
Once we know how spread that our route spread from north to south, and west to east, we can determine where the center of the map should be. I learnt a lot about Mercator projection and Web Mercator that Google Map is using for the calculation. The Map.center property is a tuple of latitude and longitude that specify the center of our map.
Plot altitude chart without using Google Elevation service
Google Maps JavaScript API has an Elevation service that allows me to plot the elevation data under the map canvas, it works fine for my bike tracks that is below 50 or 60km. However the API has a Usage Limits that for longer route that I have (such as a 70km or 80km ride), it will produce a 413 error (Request Entity Too Large), unless I'm a premium user, or I have to reduce the number of trackpoints for generating the elevation data. Since the trackpoints data that I parsed from my TCX file contains the altitude and accumulated distance information, so I decided to give it a try to plot my own altitude/distance chart and show it on the web page without using the Google Elevation service.
It is quite straightforward to use Matplotlib for creating a line chart based on the distance data from the trackpoints as x-axis data, and the altitude data for the y-axis. In order to show the chart on a web page, we need to save the chart image in either .png or .svg format. SVG format in fact is valid html tag and can be easily insert into an html document. But I don't want to save the generated chart to hard disk and then retrieve it again for sending it to html page because data read/write on hard disk is a relative slow process. I found my answer from this blog.
Python has io.BytesIO object for writing binary streams, such as images, to a buffer with the same syntax as used for writing binary data to files. The idea is to let Matplotlib write to a io.BytesIO object and afterwards extract the series of bytes in the plot file from this object and embed it in the HTML file directly. The saved SVG image contain the xml header which we don't need it so I split the header and only keep the part that started with '<svg' tag. The Map.altitude_svg property hold the SVG data that can be inserted into html template for displaying the altitude chart.
Now we have all the ingredients, we are ready to create the Flask app and put everything together.
Display the map using Flask
Setting up Flask is quite straightforward and Flask website provide excellent documentation. Copy and paste the Google Maps API key as app.config['API_KEY'] value, and get the title of the web page from Route.title property which basically the file name of the TCX file. We pass those data into the render_template through a python dictionary context. The instance of Map class is also get pass into the template. Save the flask app as app.py
app.py
from flask import Flask, render_template

app = Flask(__name__)
app.config['API_KEY'] = "copy_and_past_google_map_API_key_here"
route = Route("20180117_023924.tcx.xml")
map = Map(route.trackpoints)

@app.route('/')
def index():
    context = {
        "key": app.config['API_KEY'],
        "title": route.title
    }
    return render_template('template.html', map=map, context=context)

if __name__ == '__main__':
    app.run(debug=True)
Run the app.py using the following command, which will start the python internal web server at 127.0.0.1:5000:
python3 app.py
 * Running on http://127.0.0.1:5000/ (Press CTRL+C to quit)
 * Restarting with stat
 * Debugger is active!
 * Debugger PIN: 121-341-708
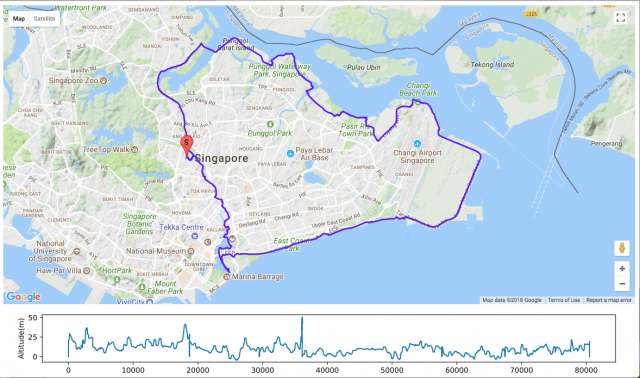
Launch browser and point the url to 127.0.0.1:5000 and you should see the cycling track along with altitude data shown on google map.

Github and Youtube
The entire code is available at my Github page. I provide two TCX files in the repository, one you've seen above is downloaded from Endomondo, and another is from Ride with GPS. By the way, for the route you see above, it is quite a scenery route, I have a video on my YouTube channel which showing my ride for a slightly shorter (73km) but similar route. If you ever visiting my country, I am happy to show you around, on the bicycle, of course.
Happy hacking, Happy cycling!
Hello sir! I’m from india i ma beginner to flask and i m decided to develop a taxi like app .can u give me any suggestions that how to do it using flask ..thank you .
Your above project was really helpful to me ..
Hi, does the google api charge to trace this route?
There is a free tier, but since July 2018, Google’s conditions for Maps APIs have changed. You have to assign a billing method to it so that you are able to use it (even for the free tier). Check more information here: https://cloud.google.com/maps-platform/pricing/. Personally I don’t want to give Google my credit card number, so I no longer using Google API for this kind of application since then.