Recently I build a web application which is basically an interactive transport system map that utilise the shortest path algorithm. The web application sounds trivial but it demonstrates a practical implementation of graph data structure and shortest path algorithm that you probably studied during your Computer Science subject.
What is a Graph
To be honest, I never look into graph as a data structure and associated algorithms ever since my days of Computer Science study. A Graph is a structure or network consisting of vertices(or nodes) connected by edges. Sometimes the vertices or edges of a graph have weights or costs associated with them. The edges could also be bidirectional or unidirectional.

A graph shown in this picture can be easily represented by a data structure using a Python dictionary:
graph = {'A': ['B', 'E'],
         'B': ['A', 'C', 'E'],
         'C': ['B', 'D'],
         'D': ['C', 'E', 'F'],
         'E': ['A', 'B', 'D'],
         'F': ['D']
         }
The keys of the dictionary are the nodes of the graph. For each key, the corresponding value is a list containing the nodes that are connected by a direct edge from this node. The graph data structure in the nutshell describes the relationship between nodes and its neighbours. The path between any two nodes in a graph form a tree structure (like a parent-child relationship).
Many online tutorials about graph theory provide programming example of adding nodes and edges manually, but in reality the dataset would be much larger and it is not practical to add node or edge one by one, the graph data is likely be created in advance and stored in database or in data format like json. It can then be loaded into memory with a simple function call load_graph function shown below.
graph.py
import json


def load_graph(file_name):
    with open(file_name) as f:
        data = json.load(f)
        return data


def find_path(graph, start, end, path=[]):
    path = path + [start]
    if start == end:
        return path
    if start not in graph.keys():
        return None
    for node in graph[start]:
        if node not in path:
            newpath = find_path(graph, node, end, path)
            if newpath:
                return newpath
    return None


def all_paths(graph, start, end, path=[]):
    path = path + [start]
    if start == end:
        return [path]
    if start not in graph.keys():
        return []
    paths = []
    for node in graph[start]:
        if node not in path:
            newpaths = all_paths(graph, node, end, path)
            for newpath in newpaths:
                paths.append(newpath)
    return paths


def shortest_path(graph, start, end, path=[]):
    path = path + [start]
    if start == end:
        return path
    if start not in graph.keys():
        return None
    shortest = None
    for node in graph[start]:
        if node not in path:
            new_path = shortest_path(graph, node, end, path)
            if new_path:
                if not shortest or len(new_path) < len(shortest):
                    shortest = new_path
    return shortest
Shortest Path
In very layman terms, finding a path between two nodes involving of keeping a list of nodes between the node and its neighbours(i.e. children) by "traveling" down to each neighbour node until the destination node is found. The list generated represent a path (or parent-child relationship) between the two nodes. The find_path function shown above is a python implementation for what we just described.
The find_paths function return the path once a path is found, however, it is possible that there are multiple paths exists between the two nodes. The all_paths function do not stop when a path is found, but add the path to a list of paths and continue to "search" until all nodes are visited.
The shortest_path is quite similar to the all_paths algorithm, except that it compare the new path found with the existing path and will only keep the list of shorter path and drop the longer one. It is done so by comparing the number of the nodes in the list(i.e. the length of the list).
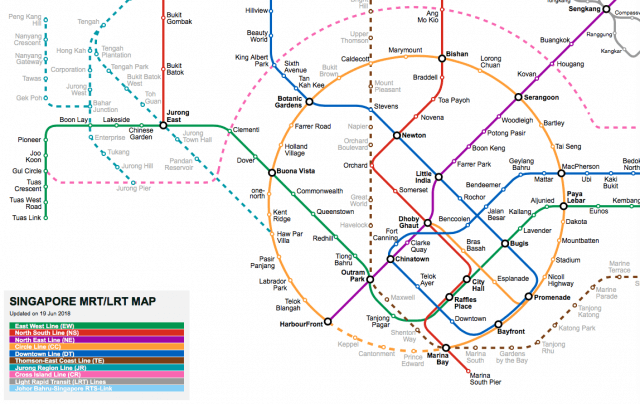
Create graph data object
An urban railway(a.k.a. Metro, Subway, Underground, MRT or MTR, depend on which country you are living) system, in its simplest form, can be represented as a graph data structure we discussed before. To make it real, I decided to use my home town Singapore MRT (Mass Rapid Transit) system as the example for my web application. As there is no open data set available that meet my data requirement, I have to create the stations_sg.json manually myself based on the information from the official system map for each station(i.e. node) and the list of stations that it connected with (i.e. list of edges).
Create an interactive system map
In order to create an interactive system map, it makes sense to have a map object in svg format than a jpg image, because svg:
- is valid html and can be added into an html page easily;
- can be targeted using JavaScript for each element on the map;
- is extendable for future update.
Luckily I found an SVG file created by Afori that is distributed under Creative Commons Attribution-ShareAlike 3.0 Unported License. I modified the svg file to match my json data, remove some of the unnecessary legends and separate the in-operation stations from not-in-service stations and make those in-opeation clickable. The complete stations_sg.svg file is available at my github page, but a portion of the SVG file is include here to show the structure and data for the benefit of the discussion.
stations_sg.svg
<svg version="1.1" xmlns="http://www.w3.org/2000/svg" xmlns:xlink="http://www.w3.org/1999/xlink" height="1007" width="1410" >

  <title>Singapore MRT/LRT system map</title>
  <rect id="bg" height="1007" width="1410" y="0" x="0" fill="#ffffff"/>

  <g id="legend">
    <!-- data for legend -->
  </g>

   <g id="lines" fill="none" stroke-width="4">
    <!-- line between each station -->
   </g>

  <g id="stns_icons" fill="#ffffff" stroke-width="2">
    <a xlink:href= "#ew" fill="#ffffff">
      <g id="stns_ew" stroke="#009645">
        <circle id="cg2" cx="1334" cy="694" r="3"/>
        <circle id="ew1" cx="1283" cy="524.5" r="3"/>
        <circle id="ew3" cx="1245" cy="634" r="3"/>
        <!-- more stations for EW line here -->
      </g>
    </a>
    <a xlink:href= "#ns" fill="#ffffff">
      <g id="stns_ns" stroke="#d42e12">
        <circle id="ns2" cx="286" cy="413" r="3"/>
        <circle id="ns3" cx="286" cy="321" r="3"/>
        <circle id="ns5" cx="286" cy="123" r="3"/>
        <!-- more stations for NS line here -->
      </g>
    </a>
    <!-- more lines here -->
  </g>

  <g id="stns_not_in_services" fill="#ffffff" stroke-width="2">
    <!-- Separate "not in services" stations from in-operation -->
  </g>
  <g id="stns_labels" font-family="Arial" line-height="100%">
    <!-- text label for each station -->
  </g>

</svg>
A user interacts with the system map by clicking on any two of station icons on the map to indicate his/her starting and ending station of a journey, the station codes will be sent back to server for calculating the shortest route for the journey, when the shortest path data is sent back form the server, it will then plot it on the map.
Interacting with the system map
JavaScript event listener is added to station icons, when the user click the first icon for the starting station, the station icon will be changed to red colour to indicate the starting station, and when the second icon is clicked, it will be coloured as green to indicate the ending station of the journey.
  // Set event listener so user can click on stations to choose start and destination
  let shortestPath = [];
  let stations = [];
  let links = document.getElementById("stns_icons");
  links.addEventListener('click', function(event) {
    let station = event.target.id;
    if (stations.length == 0) {
      event.target.setAttribute('fill', "#FF0000");
      stations.push(station);
    }
    else if (stations.length == 1) {
      event.target.setAttribute('fill', "#00FF00");
      stations.push(station);
      let url = "/api/v1/?start=" + stations[0] + "&end=" + stations[1];
      getRequest(url);
    }
    event.preventDefault();
  });
Each <circle> tag is given a unique id which matched the station code used in stations_sg.json file. The ID attribute of the corresponding <circle> that was clicked by the user will be parsed and send back to the server via a HTTP GET request as part of the URL query string /api/v1/?start=ns14&end=ns19.
  // ajax get request function (works for IE10+)
  function getRequest(url) {
    let request = new XMLHttpRequest();
    request.open('GET', url, true);
    request.send()
    request.onload = function() {
      if (this.status >= 200 && this.status < 400) {
        shortestPath = JSON.parse(this.response)['route']
        markShortestPath(shortestPath)
      }
    }
  }
The getRequest function is an Ajax get request handler. The request.onload callback function will parse the json data sent back from the server and pass it to markShortestPath function which will ‘plot’ the shortest route on the map by enlarging the station icons by 2px and turn the station icons into Cyan colour.
  // helper function to mark each stations on the shortest path with bigger Cyan circle
  let markShortestPath = function(path) {
    for (let i = 0; i < path.length; i++) {
      let station = document.getElementById(path[i].toLowerCase());
      let radius = parseFloat(station.getAttribute('r')) + 2;
      station.setAttribute('r', radius);
      station.setAttribute('fill', "#00FFFF");
    }
  }
Upon the plotting of the route, or at any giving time, user can double click on anywhere of the map to ‘cancel’ or ‘reset’ the map to initial stage (i.e. a map without any station selected). This is quite straightforward by adding an event listener for dblclick event, but for iOS devices, double taps on its touch screen is defaulted for zooming, we need a little bit work to listen to touchstart event, and intercept the double-tap event to our reset function.
  // helper function to reset the color of each station
  let reset = function(e) {
    for (let i = 0; i < stations.length; i++) {
      document.getElementById(stations[i]).setAttribute('fill', "#FFFFFF");
    }
    stations = [];
    if (shortestPath != []) {
      for (let i = 0; i < shortestPath.length; i++) {
        let station = document.getElementById(shortestPath[i]);
        let radius = parseFloat(station.getAttribute('r')) - 2;
        station.setAttribute('r', radius);
        station.setAttribute('fill', "#FFFFFF");
      }
      shortestPath = [];
    }
    e.preventDefault();
  }

  // Doubleclick to reset the station selection
  document.addEventListener('dblclick', reset);
  let tapped = false;
  document.addEventListener('touchstart', function(e) {
    if(!tapped){
      tapped=setTimeout(function(){ tapped=false; },300);
    }
    else {    //tapped within 300ms of last tap. double tap
      clearTimeout(tapped);
      tapped=false;
      reset(e);
    }
  });
The reset function reset the station selection and all the station icon colour and size to its default.
We are basically almost done with client-side of codes for our interactive system map. It is time to look into the server side of programming for communicating with the browser.
Create a Web Application Server
We already have the functions for loading the station graph data object, and for calculating the shortest path between two stations written in Python, what we need is to handle the requests from the client and to serve the corresponding data to the browser. To do that, I decide to use Flask web development framework to accomplish that.
import json
from graph import load_graph, shortest_path
from flask import Flask, request, render_template, jsonify


stations = load_graph('static/stations_sg.json')
app = Flask(__name__)


@app.route('/')
def index():
    return render_template('index.html')


@app.route('/api/v1/')
def api():
    req = request.args
    route = shortest_path(stations, req['start'], req['end'])
    if route==None:
       return jsonify({'route': 'null'}), 400
    else:
       return jsonify({'route': route}), 200


app.run(debug=True)
Simply run the application through command line:
$ python app.py
 * Running on http://127.0.0.1:5000/ (Press CTRL+C to quit)
This launches a simple Flask build-in web server at localhost port 5000.
Our application provides two url endpoints. When user open http://127.0.0.1:5000 in a browser, a html page index.html will be served.
The index.html is quite straightforward with a little bit help using jinja template feature to load the stylesheet, javascript and to include the svg file.
<!DOCTYPE html>
<html>
  <head>
    <meta charset="utf-8">
    <meta name="viewport" content="width=device-width, initial-scale=1">
    <title>Singapore MRT Interactive Map</title>
    <link rel="stylesheet" href="{{ url_for('static', filename='style.css') }}">
  </head>
  <body>

    {% include 'stations_sg.svg' %}

    <div id="modal" class="modal">
      <div class="modal-content">
        <p><strong>Click</strong> to select stations</p>
        <p><strong>Doubleclick</strong> to reset selection</p>
      </div>
    </div>

    <script src={{ url_for('static', filename='front-end.js') }}></script>
  </body>
</html>
Although our interactive map is quite intuitive to use, but it is still a good idea to provide some sort of instructions when the user is accessing the webpage. We create a "modal" box to show the instruction.
The css style the html section as a greyish modal box with semi-transparent background:
.modal {
  display: block;
  position: fixed;
  top: 50%;
  left: 50%;
  transform: translate(-50%,-50%);
  -ms-transform: translate(-50%, -50%);
  -webkit-transform: translate(-50%, -50%);
  width: 280px;
}
.modal-content {
  color: #FFFFFF;
  text-align: center;
  margin: auto;
  padding:20px 0;
  white-space: nowrap;
  border-radius: 10px;
  background-color: rgba(100,100,100,0.9);
}
With a little of JavaScript, we set the modal box to display for 3 seconds before it is dismissed.
  // Dismiss Instruction modal after 3 seconds
  let modal = document.getElementById('modal');
  window.setTimeout(function() {
    modal.style.display="none";
  }, 3000);
When a get request is sent by the browser to http://127.0.0.1:5000/api/v1/ follows with the query string ?start=ns14&end=ns19, the request.args will be parsed to get the starting and ending station codes, and pass into shortest_path function as arguments for the calculation, the shortest path result will be encoded in json format and return back to the browser.
We now have a fully function interactive Singapore MRT system map, along the way, we re-visit the graph data structure and apply the shortest path algorithm in real world example. It looks me a few months to complete this project, not because of the complexity, it is because of the opposite that once I figure out algorithm and realise how easy it is to create an interactive map, I sort of lost the interest on it, and drop it for a few month before finishing it.
It is not perfect yet
But the algorithm is not perfect in real world scenario yet. For example, you will notice that the algorithm sometime suggests a route that take a couple of exchanges than a direct route which might have one more node and therefore not the shortest route. In the real world, you probably won't take the route suggested by the algorithm and opts for the direct route even though it is one-station longer because every exchange from one route to another is time-consuming and eventually take longer time to reach the destination. In our example, we assumed the weight between nodes are equal, while may not be the case in real application. The weight in real world example could be the cost, or travel time between the two stations. Maybe that will be the next step to fine tune it or if you come out an algorithm that involved the weight, I would like to hear from you.
The complete codes two python examples available at my github.
A live demonstration is hosted at SMRT Interactive Map.
Hello , Loved the code that you have written. i want to use pure python to create something like this , do you have any idea how could i ?
JavaScript is used to facilitates the interaction between the user and the map. Without it, you can only provide two text box for user to input the start and destination, and for each user submission, the server will have to resend the rendering to the browser, which is not a good user experience.
Hi I just wanted to know if this code also changes between stations and finds all of the possible routes and then compares them to give the client the best route?
With the help from the JavaScript code for the front-end, yes, it get the depart station and alight station from the user and calculate the route using the python algorithm. You can try that out on the https://www.e-tinkers.com/projects/smrt (it doesn’t works for old browser such as IE or old iPad though). To get ALL the possible routes, use the all_paths() function, to get the shortest route, use the shortest_route() function. However, please noted that the shortest route is not necessary the BEST route to human as the shortest route is based on number of stations, for example, a shortest route could involved 3 exchanges and yet has less number of stations than a direct route which might be 1 more station longer. To calculate BEST route, weight need to be considered, and the weight could be time or distance, or most direct route…